How-To Create a Single View for All Fields


Managing multiple fields within Atlassian Analytics can often become complicated, especially when dealing with non-core Jira fields. Our latest video tutorial addresses this challenge by demonstrating how to create a single view for all fields, simplifying the process of building complex charts and dashboards.
AA-12 - YouTube Video
Step 1: Identify the Fields to Include
Start by identifying all the fields available in your data source. Extract the field names from the ‘Issue_Field’ table and download the results as a CSV file. This step helps in selecting the relevant fields for your reporting needs.
Excluding Specific Fields:
- Avoid including Labels, Multi-Select, or Multi-Checkboxes fields. For handling these fields, refer to our specific tutorials on enabling reporting using Labels and Multi-Select Custom Fields.
Step 2: Download and use the SQL Query Builder Spreadsheet
Go to this page to download the SQL Query Builder Excel file.
This tool will help you construct the SQL query needed to join all selected fields into a single row per issue.
The supported scenarios using this spreadsheet are:
- Simple Fields - by adding the field name without any additional settings, this field will be included in the final result under a column with the same name and of type Text
- Merged Fields - combine 2 or 3 fields into one by listing the field names
- Transformed Fields - if you want to look up a value from a different table, based on the value of the field as stored under the Issue Field table
- Renamed Fields - adjust the outcome field name for better usability - this is required if you Merged or Transformed the fields
- Convert the Data Type - define the resulting field type - if left empty, the data type will remain text.
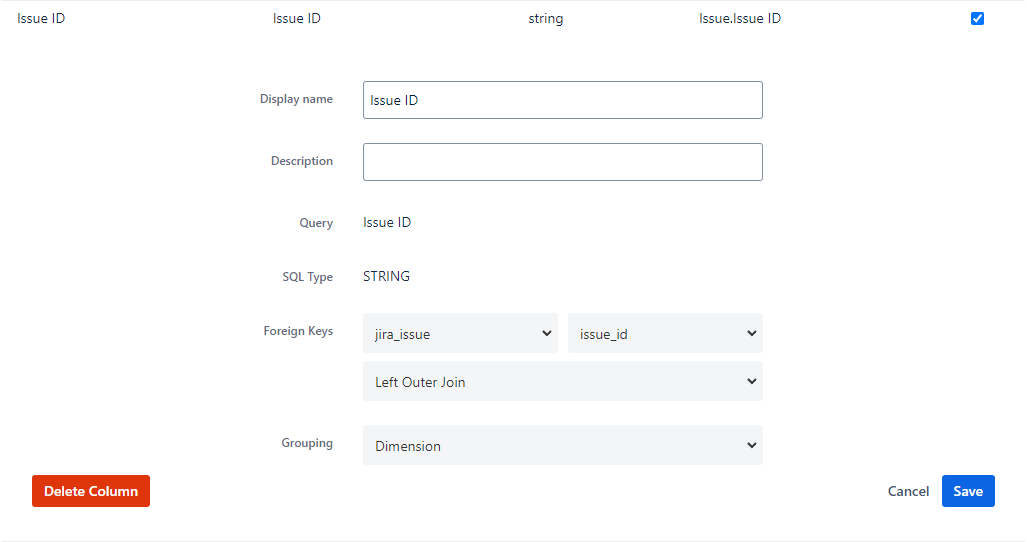
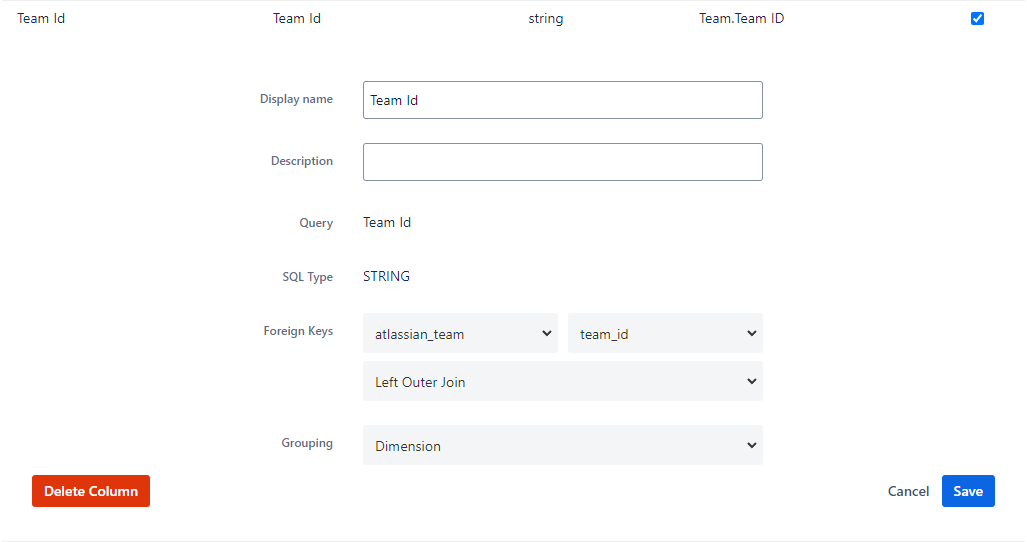
Step 3: Setting Up the Custom Table in Atlassian Analytics
Once you’ve generated the SQL query using the Excel file, the next step is to use it to create a custom table.
Name this table something descriptive, like 'view_All_Issue_Fields', to easily identify its purpose. Ensure it integrates smoothly with existing data by linking it to the primary tables using LEFT OUTER JOINs. This ensures all issues are included in your queries.
Step 4: Test
With the custom table set up, test its functionality by creating a new chart in the visual SQL editor.
- Choose 'Issue Key' and 'Summary' from the 'Issue' table, and 'Story Points' and 'Start Date' from the 'view_All_Issue_Fields' table.
- Add Filters: Apply conditions to filter specific fields, such as where 'Story Points' is not null. This step demonstrates the ease of setting filters now that all fields are available in a single row.
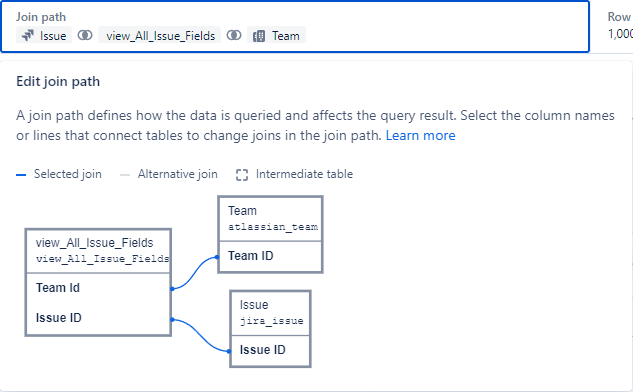
Notice how the join path includes ‘view_All_Issue_Fields’ linking the Team and Issue tables, automatically configured by the relationships set up during the creation of the custom table.
Final Thoughts
By following these steps, you can create dynamic and complex dashboards with ease, empowering both technical and non-technical users to leverage the full potential of their project data.
Don't forget to download the Excel file and refer to the YouTube video for step-by-step instructions and additional tips.
Join the conversation with your questions and feedback, and stay tuned for more tutorials that help you harness the power of Atlassian tools!